



Agricultural Lighting Strategies in Portugal — Insights from DLI Mapping
by László Sipos
The need for DLI mapping
The DLI represents the total amount of photosynthetically active radiation (PAR) received by plants over the course of a total day [mol·m−2·d−1]. PAR refers to the radiation within the wavelength range of 400 to 700 nm. The standard unit for DLI is expressed in mol·m−2·d−1, and it is calculated using the following formula: DLI = photosynthetic photon flux density (µmol·m−2·s−1) × photoperiod (h·d−1) × 3600 (s·h−1) ×10−6. Accurate assessment of photosynthetically active radiation (PAR, 400–700 nm) and the Daily Light Integral (DLI) is essential for optimizing horticultural lighting, shading strategies, and crop management. Existing large-scale maps often lack resolution or consistent scales, limiting regional decision support.
Study objective
To develop a semi‑automatic workflow and produce high-resolution (2 mol·m−2·d−1) and moderate-resolution (5 mol·m−2·d−1) DLI maps for mainland Portugal, and to analyze spatial (north–south, regional) and seasonal (monthly/seasonal) DLI patterns and ranges to support agricultural lighting strategies.
Methodology
A semi-automatic workflow for DLI mapping was developed. A spatial sampling grid with a 30 m resolution, derived from the SRTM DEM (WGS84/EGM96), was used as the georeferenced coordinate framework. The data pipeline executes a PHP script that sends latitude and longitude values to the remote DLI server of SunTracker and stores the returned monthly DLI values in JSON format. DLI is calculated based on photosynthetically active radiation (PAR, 400–700 nm) using the formula: PPFD × photoperiod × 3600 × 10⁻⁶. Visualizations were generated using 2 and 5 mol·m⁻²·d⁻¹ intervals to support both regional and continental-scale comparisons.
Key results
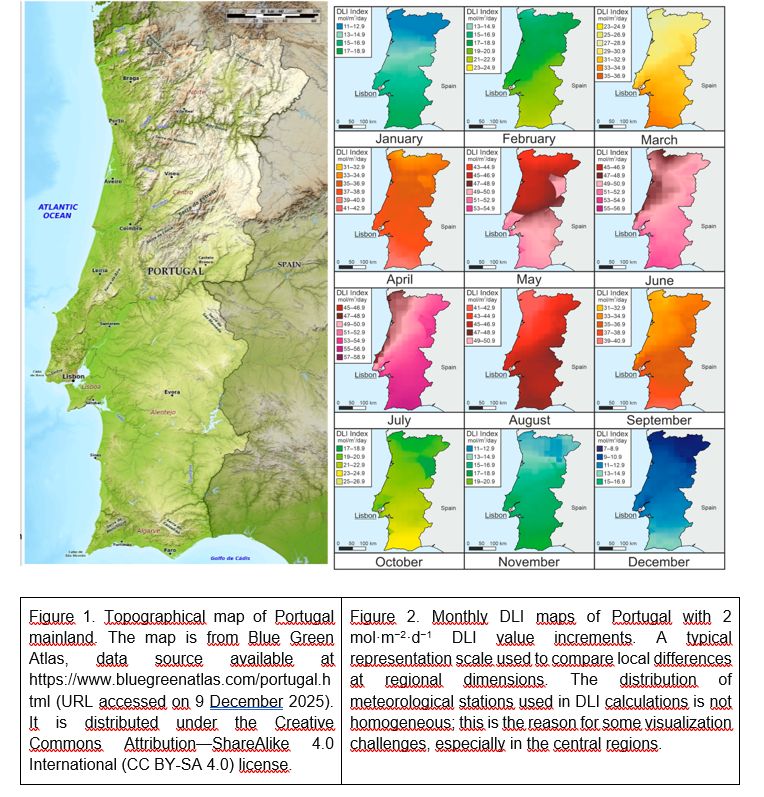
The results reveal a clear north–south spatial gradient, with DLI values increasing from the cloudier northern regions toward the sunnier southern areas. A pronounced seasonal pattern is also evident: DLI values are lowest in winter (December–February, approximately 7–17 mol·m⁻²·d⁻¹), increase rapidly during spring, and reach their peak in summer (June–July, up to about 45–59 mol·m⁻²·d⁻¹, with the maximum in July), followed by a decline in autumn. Regionally, northern areas are characterized by frequent cloud cover and winter DLI values ranging from approximately 7 to 19 mol·m⁻²·d⁻¹. Central regions show a west–east differentiation influenced by topography, with summer DLI values in eastern parts reaching around 45–55 mol·m⁻²·d⁻¹. In contrast, southern regions (Alentejo and Algarve) exhibit the highest DLI values throughout the year, with summer values exceeding 56 mol·m⁻²·d⁻¹ and winter values in Algarve remaining above approximately 17 mol·m⁻²·d⁻¹. Seasonal variability also differs, with narrower DLI ranges in winter (8–12 mol·m⁻²·d⁻¹) and broader ranges during spring and summer (11–14 mol·m⁻²·d⁻¹).
Interpretation / attribute‑level insights
Topography and oceanic influence act as major modifiers of DLI patterns: orographic cloud formation in northern mountainous areas locally reduces DLI, while the Atlantic influence moderates conditions along coastal regions, resulting in narrower DLI ranges. Static environmental factors, such as altitude, slope, and aspect, create persistent spatial patterns,
whereas dynamic factors (including cloud cover, aerosols, and precipitation) drive short-term variability. In terms of mapping, resolution involves a trade-off: a 2 mol·m⁻²·d⁻¹ interval captures finer local and regional differences more effectively, while a 5 mol·m⁻²·d⁻¹ interval is more suitable for continental-scale comparisons and policy-oriented applications.
Impact on agricultural lighting and management
DLI maps provide valuable decision support by enabling crop- and region-specific recommendations for lighting and shading management, and by identifying areas where supplementary lighting is required, particularly in northern or low-DLI regions. The results suggest that DLI mapping should be integrated with additional environmental layers, such as soil properties, water availability, topography, temperature, and biodiversity, to support more comprehensive agricultural planning. In high-irradiance regions, strategies such as shading, agrivoltaic systems, or dual-use approaches can help mitigate heat stress and reduce water demand. Furthermore, data-driven forecasting methods and machine learning models, such as RLS-based DLI prediction, can complement spatial mapping in greenhouse management, although issues related to model stability and seasonal variability must be carefully considered.
Limitations and data quality considerations
The accuracy of the results depends on the density and spatial distribution of meteorological stations, the availability of radiation measurements, and the level of detail in the DEM and topographic data. Handheld DLI instruments provide only point-in-time measurements and therefore cannot replace spatially interpolated DLI maps, which capture spatial variability. The current mapping approach is based on PAR (400–700 nm), while future developments may extend to include ePAR (400–750 nm) and PBAR (280–800 nm), supported by improved spectral measurement technologies.
Conclusion and Implications for future work and policy
DLI maps should be integrated into agricultural policy frameworks and local advisory services, and combined with in situ sensor networks or farmer-based observations to improve data density and increase the realism of spatial representations. For practical applications, maps with a 2 mol·m⁻²·d⁻¹ resolution are recommended for local-scale planning, while 5 mol·m⁻²·d⁻¹ resolution is more suitable for national and continental-level comparisons and policy development. In addition, the promotion of dual-use land management practices such as agroforestry and agrivoltaics, together with tailored shading and supplemental lighting strategies, can enhance agricultural resilience under changing climate conditions.
The study provides high‑resolution, seasonally explicit DLI maps for mainland Portugal that reveal a dominant north–south gradient and clear monthly/seasonal patterns (lowest in winter, peak in July). These maps, along with the semi‑automatic workflow, form practical decision‑support tools for horticultural lighting design, shading management, and regional agricultural strategies. Future improvements should combine higher spectral resolution, denser local measurements, and integration with thematic agro‑climatic layers.
 Szabó D., Jung A., Varga Z., Hajdú E., Revoly A., Lausch A., Vohland M., Sipos L. Agricultural Lighting Strategies in Portugal: Insights from DLI Mapping.
Agronomy 2025, 15, 2860. https://www.mdpi.com/2073-4395/15/12/2860