



EU sanctions and Visegrad–Russia trade
Csaba Weiner
Research questions and scope
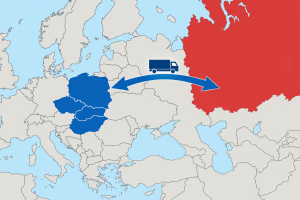
Since 2014, the European Union has imposed successive rounds of sanctions on Russia, which expanded substantially after Russia’s full-scale invasion of Ukraine in February 2022. But how did these measures affect trade between Russia and the Visegrad countries – Czechia, Hungary, Poland, and Slovakia? Our recent paper addresses this question by analysing bilateral trade over the period 2013–2024, covering both sanctions periods: 2014–2021 and from 2022 onwards. We address three questions. First, what are the overall effects of the two sanctions periods on Visegrad countries’ exports to and imports from Russia? Second, how do these effects differ across product groups, especially between heavily sanctioned and reference groups? Finally, do exports and imports respond differently, with distinct level shifts and trade trends around the 2014 and 2022 breakpoints?
Methods and data
We use two data sources. The first is two-digit Harmonised System (HS2) import and export data from the International Trade Centre’s Trade Map. The second is a list of eight-digit Combined Nomenclature (CN8) product codes subject to EU sanctions, compiled from EU Council Regulations published in the Official Journal of the European Union.
Our analysis proceeds in three steps. First, we identify all eight-digit product codes covered by EU sanctions adopted between 2014 and 2024 and calculate their share within each two-digit product group, using the sanctions in force as of the end of 2024. Second, we select the product groups for analysis. We focus on heavily sanctioned groups that account for at least 1% of total exports to or imports from Russia in at least three Visegrad countries in both 2013 and 2021 and complement them with three non- or lightly sanctioned reference groups. Finally, we estimate two Poisson pseudo-maximum likelihood (PPML) models.
The first is a gravity-based model with country-pair fixed effects, alongside exporter-year fixed effects for exports and importer-year fixed effects for imports. It uses five control countries – China, France, Germany, the United Kingdom, and the United States – all important trading partners of the Visegrad countries. This model compares Visegrad countries’ trade with Russia to their trade with these five control countries and estimates the average effects of the two sanctions periods relative to 2013.
The second is an interrupted time-series PPML model without control markets, with exporter fixed effects for exports and importer fixed effects for imports. It estimates the level shift in 2014 relative to 2013 and the annual trade trend during 2014–2021. The level shift in 2022 is measured relative to the trade level predicted for 2022 by continuing the estimated 2014–2021 trend. The model also estimates how the annual trend during 2022–2024 differs from the trend during 2014–2021. We use this model as a complementary analysis.
Selected product groups
The export analysis covers five heavily sanctioned product groups. Electrical machinery and equipment is the most heavily sanctioned, followed by vehicles, plastics, machinery, and optical, measuring, and medical instruments. Two reference groups complement the analysis: pharmaceuticals, which are not subject to EU sanctions, and edible vegetables, which are almost untouched by EU measures but are heavily affected by Russian countersanctions.
On the import side, the analysis focuses on three heavily sanctioned product groups, led by mineral fuels, followed by inorganic chemicals and rubber. The reference groups are fertilisers, which are only lightly sanctioned, and edible vegetables, which are entirely free from EU sanctions. One important caveat concerns the import analysis. Inorganic chemicals and rubber are only slightly more heavily sanctioned than fertilisers. This reflects a trade-off between sanction intensity and the need to select product groups with sufficiently large trade shares in Visegrad–Russia trade.
Descriptive statistics
The selected sanctioned product groups accounted, on average across the four Visegrad countries, for more than 60% of exports to Russia in both 2013 and 2021, although their importance varied considerably across the region. Their share was highest in Slovakia and lowest in Poland. Exports were dominated by vehicles and machinery, followed by electrical machinery and equipment. In Hungary, however, pharmaceuticals were already established as one of the leading export groups.
By 2024, compared with 2021, the shares of the three main sanctioned export groups had declined sharply in all Visegrad countries except Slovakia. There, machinery had increased its share, as total exports to Russia declined more sharply than machinery exports. Machinery had become the largest of the three groups in every Visegrad country, with pharmaceuticals ranking first among all export product groups in Hungary and Poland and second in Czechia. In Slovakia, they ranked only seventh, while machinery remained the largest export group overall.
On the import side, mineral fuels overwhelmingly dominated, with the highest shares in Slovakia and Hungary and the lowest in Poland. Their share increased in all four Visegrad countries in 2022. By 2024, it had risen further in Hungary and Slovakia but fallen in Czechia and, much more sharply, in Poland. In Poland, the share of mineral fuels was then close to that of fertilisers, with the two groups ranking first and second, respectively, among all import product groups in both 2023 and 2024.
PPML fixed-effects results for exports
Both sanctions periods had substantial and statistically significant negative effects on total exports and almost all selected product groups relative to 2013. The only exception was optical, measuring, and medical instruments during the first sanctions period, for which the estimated effect was negative but not statistically significant. The effects were consistently stronger in the second sanctions period: total exports declined by an estimated 45.8% during 2014–2021 and 83.7% from 2022 onwards.
Despite the near absence of EU sanctions, the largest estimated export declines in both sanctions periods were recorded for edible vegetables (91.6% during 2014–2021 and 98.6% from 2022 onwards), highlighting the impact of Russian countersanctions. The smallest estimated declines were recorded for optical, measuring, and medical instruments (33.7% and 69.1%, respectively). The decline became much larger in the second sanctions period, when EU export restrictions were extended to more products within the group. Pharmaceuticals, although not subject to EU sanctions, also recorded substantial estimated declines (57.9% and 69.8%, respectively), which may reflect broader conflict-related spillovers.
Electrical machinery and equipment already experienced a large estimated export decline in the first sanctions period (59.8%), as did vehicles (57.1%), with even larger declines in the second (95.0% and 96.0%, respectively), consistent with the near-disappearance of these exports in the descriptive data by 2024. The decline was less pronounced for machinery (38.4% in the first sanctions period and 87.0% in the second). The large declines during the first sanctions period occurred even though EU sanctions covered only arms, dual-use goods, and specific technologies associated with advanced oil exploration and production. This suggests that factors beyond direct EU export restrictions also contributed to the observed reductions in exports. For example, the decline in vehicle exports was likely driven by the depreciation of the rouble and weaker consumer demand, as reflected in the sharp fall in new vehicle sales in Russia in 2015.
PPML interrupted time-series results for exports
In 2014, there was an immediate and statistically significant downward level shift in total exports and all selected product groups relative to 2013. During the first sanctions period, the estimated trend in total exports was almost flat and not statistically significant. Most selected product groups showed modest annual increases or decreases that were not statistically significant. Three groups had statistically significant trends: a marked downward trend for edible vegetables, and slight upward trends for plastics and for optical, measuring, and medical instruments.
At the 2022 breakpoint, total exports and all five sanctioned product groups registered immediate downward level shifts relative to the projected 2014–2021 trend. These shifts were statistically significant at the 5% level, except for plastics, where significance was limited to the 10% level. Edible vegetables and pharmaceuticals recorded positive shifts, significant only for edible vegetables and only at the 10% level. From 2022 onward, annual trends shifted strongly downward for total exports and all sanctioned product groups, with statistically significant trend changes. The largest downward trend changes were recorded for vehicles and electrical machinery and equipment, followed by machinery. The estimated trend changes for the two reference groups were positive, though statistically significant only for edible vegetables.
PPML fixed-effects results for imports
As the models estimate changes in trade values rather than quantities, price movements are particularly important when interpreting the import results. Imports from Russia were overwhelmingly dominated by mineral fuels, whose absolute import values were also very high. By contrast, mineral fuel imports from the control countries generally had small shares of total imports and low import values, although there were some notable exceptions. In the interrupted time-series model, which does not include control countries, price-driven changes in trade values can also appear as level shifts or trends. For example, crude oil prices collapsed in 2015 and 2020, but surged in 2021 and 2022. Natural gas prices rose far more sharply than crude oil prices in those two years.
While Russian mineral fuels did not fall under EU import sanctions during the first sanctions period, restrictions were introduced gradually during the second: coal from August 2022; crude oil from December 2022 (with pipeline crude oil exempt for Hungary and Slovakia and temporarily exempt for Czechia, Germany, and Poland); refined petroleum products from February 2023 (with temporary exemptions for Croatian imports of vacuum gas oil and Czech imports of products refined in other EU member states from Russian pipeline crude); and liquefied petroleum gas – LPG, not liquefied natural gas, LNG – from December 2024. Throughout the period analysed, Hungary, Slovakia, and Czechia could continue to import Russian crude oil via pipelines, while Russian pipeline gas remained outside the scope of EU sanctions and Russian LNG was subject only to negligible restrictions.
In the fixed-effects model, total Visegrad imports from Russia declined slightly more than exports to Russia during the first sanctions period (49.2% vs. 45.8%), but substantially less during the second (68.8% vs. 83.7%). Edible vegetables were the only product group with positive estimated effects in both sanctions periods, and both effects were statistically significant. Lower production costs could give Russian edible vegetables a competitive advantage, putting pressure on EU farmers. All other selected product groups recorded negative effects, which were statistically significant except for inorganic chemicals during the first sanctions period.
PPML interrupted time-series results for imports
The interrupted time-series estimates indicate an immediate and statistically significant downward level shift in total imports and all sanctioned product groups in 2014 relative to 2013. Among the two reference groups, edible vegetables recorded a positive shift, significant only at the 10% level, while fertilisers recorded a negative but statistically insignificant shift. During the first sanctions period, the estimated trends for total imports and most product groups were small and not statistically significant at the 5% level. Edible vegetables stood out with a marked and statistically significant upward trend. Mineral fuels showed a slight downward trend and inorganic chemicals a slight upward trend, both significant only at the 10% level.
At the 2022 breakpoint, mineral fuels registered a positive and statistically significant level shift relative to the projected 2014–2021 trend. As discussed earlier, the model estimates changes in trade values rather than quantities, and this positive shift likely partly reflects the sharp rise in energy prices in 2022. The level shifts for total imports and inorganic chemicals were also positive, but neither was statistically significant. Rubber and the two reference groups recorded negative shifts, significant only for rubber and edible vegetables. From 2022 onward, annual trends shifted strongly downward for total imports and all sanctioned groups, with statistically significant trend changes. Both reference groups recorded upward trend changes, but neither change was statistically significant.
Conclusions
Three main takeaways emerge from our analysis. First, export effects were already strongly negative during the first sanctions period, particularly for the most heavily sanctioned manufactured product groups, and intensified further from 2022 onward. Second, import effects were more difficult to interpret because of the dominant role of energy products and volatile energy prices, but intensified from 2022 onward. Finally, the effects differed considerably between exports and imports, across product groups, and between the two sanctions periods.
 |
Reference Głodowska, A., Hajdukiewicz, A., Pera, B., & Weiner, C. (2026). Trade Effects of EU Sanctions against Russia: Evidence from the Visegrad Group. The World Economy 49(8), 1692–1709. This research was supported by the National Research, Development and Innovation Office of Hungary under Grant No. FK-146590. |